NCUA Share Insurance Fund Update: Diving into CAMELS Code Data
NCUA held its February Board meeting today, which included a quarterly update on the share insurance fund. We've seen a growth in both the number of CAMELS 3/4/5 credit unions, as well as the shares and assets they hold, in recent quarters. Let's see how things looked at year-end.
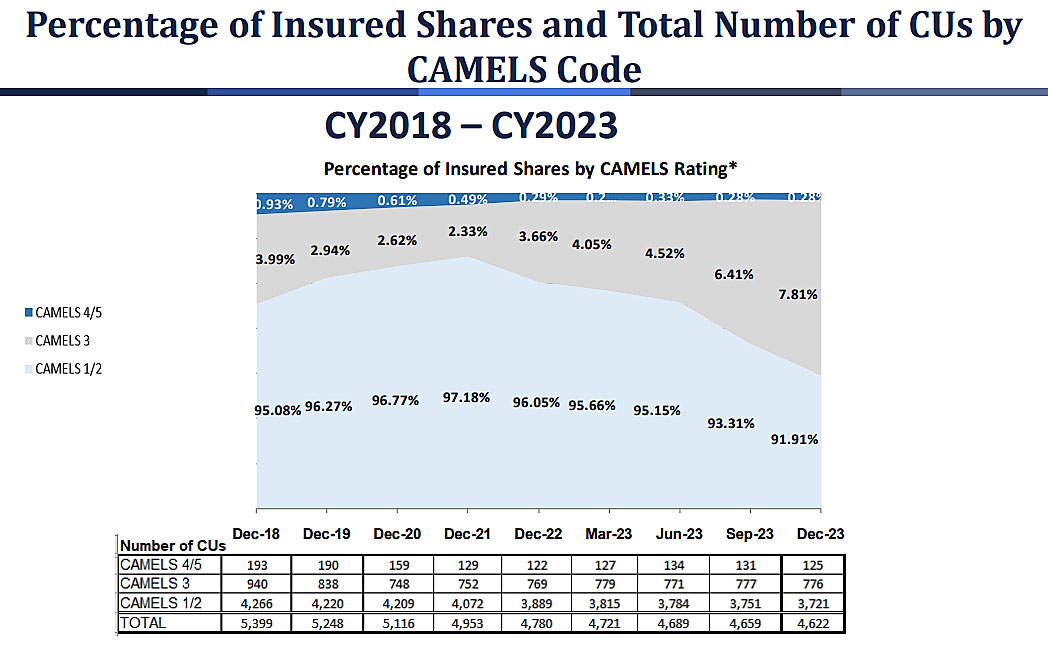
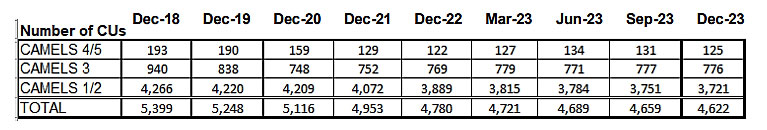
NCUA's briefing provides data on the total number of credit unions in each CAMELS category, as well as the percentage of insured shares held by credit unions in each CAMELS category.
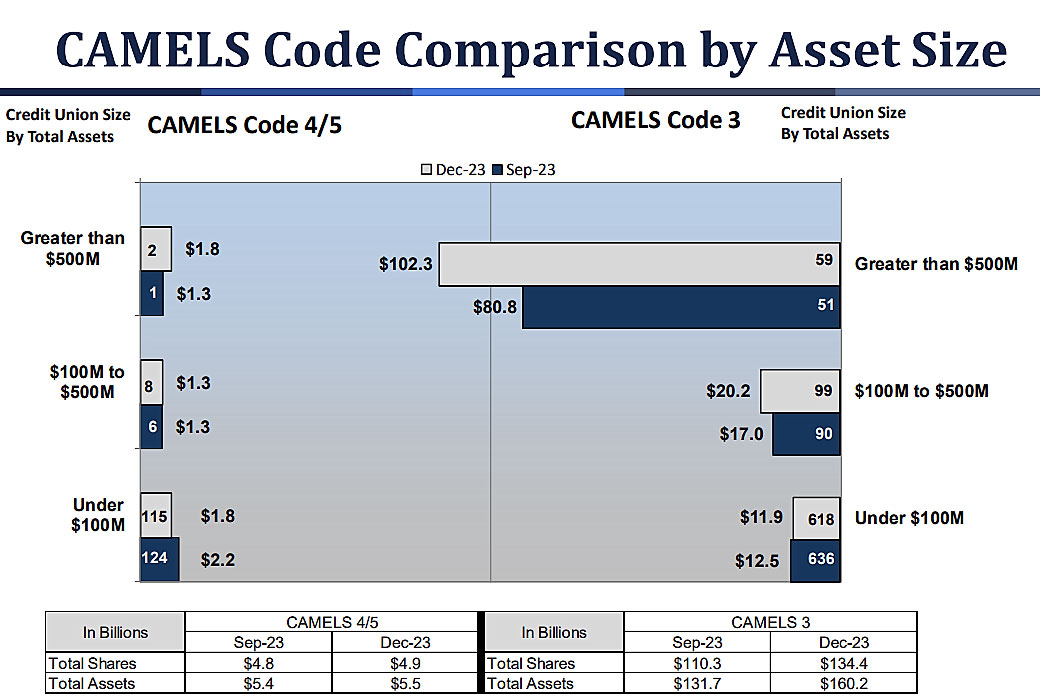
They also give some data on CAMELS 3 and CAMELS 4/5 credit unions, showing the number of small, medium, and large credit unions in each category, as well as assets held by those credit unions.
Here are some trends shown in the data this quarter:
CAMELS 4/5 - Holding steady
CAMELS 4/5 credit unions held relatively steady in the fourth quarter, with total shares held by CAMELS 4/5 credit unions increasing from $4.8 billion to $4.9 billion, and total assets increasing from $5.4 billion to $5.5 billion. The total number of CAMELS 4/5 credit unions fell in Q4 from 131 to 125. CAMELS 4/5 credit unions hold 0.28% of all insured shares - the same % as in Q3.
The number of small credit unions (under $100 million in total assets) decreased in Q4 from 124 to 115. Those credit unions now hold $1.8 billion in total assets. The increase was in larger credit unions (over $500 million in total assets), which went from 1 credit union with $1.3 billion to 2 credit unions with $1.8 billion in total assets.
CAMELS 3 - Total assets and shares continue to rise faster than number of CUs
The total number of CAMELS 3 credit unions stayed steady, decreasing by 1 from 777 to 776 in Q4. However, the percentage of insured shares held by CAMELS 3 credit unions increase in Q4 from 6.41% to 7.81%. This continues a trend going back to December 2021, when that figure was 2.33%.
CAMELS 3 credit unions held $134.4 billion in shares and $160.2 billion in total assets at the end of Q4, up from Q3's figures of $110.3 billion in shares and $160.2 billion in assets. Most of this growth is accounted for in the large credit union segment. At the end of Q3, there were 51 CAMELS 3 credit unions with over $500 million in assets. Collectively those credit unions held $80.8 billion in total assets. At the end of Q4, those numbers had increased to 59 credit unions holding $102.3 billion in total assets.
The most alarming part of this increase is its continuation of the trend. In the Q3 update, the increase in total assets held by large credit unions went from $47.7 billion to $80.8 billion. Now we have an additional increase to $102.2 billion - a 114% increase in 6 months. This is certainly a trend the NCUA Board and staff are monitoring closely, even though the number of credit unions in this category is not growing as quickly.
Other Trends - Consolidation continues, and credit union failures costing the share insurance fund are trending down.
The total number of credit unions at year-end was 4,622, down from 4,659 in Q3 and 4,780 at year-end 2022. As we know, this continues a decades-long trend as mergers between credit unions continue to take place.
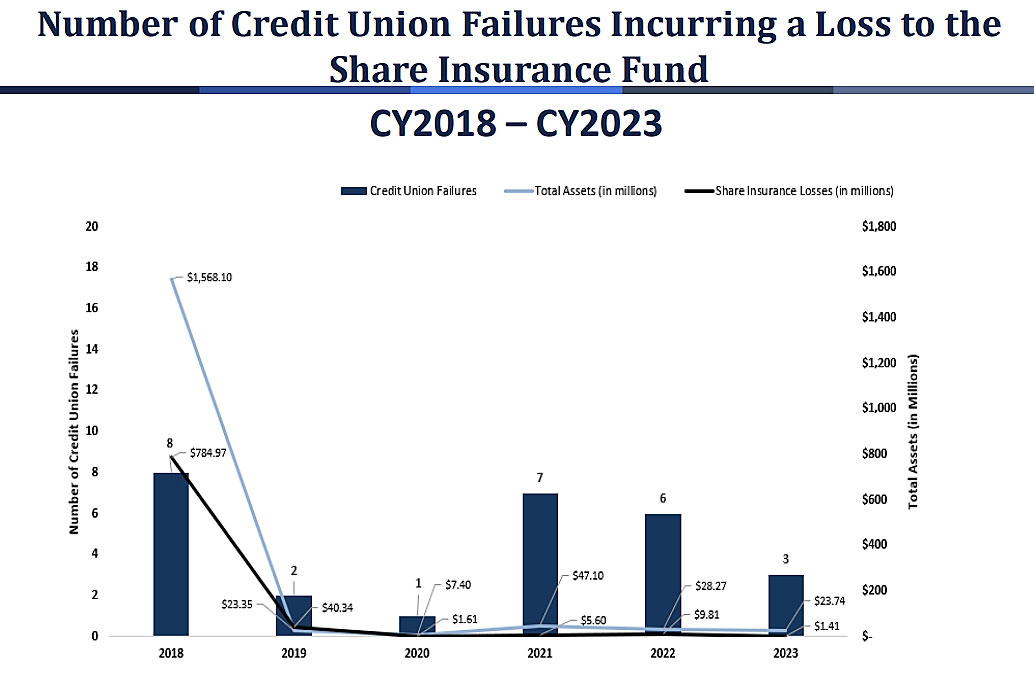
There were only three credit union failures incurring a loss to the share insurance fund in 2023. These credit unions held $23.74 million in total assets, and resulted in $1.41 million in losses to the share insurance fund. All of these data points represent downward trends since 2021.
Going into this meeting, some expected a more substantial increase in the number of CAMELS 4/5 credit unions and their total assets and shares. While that did not play out this quarter, the growth in CAMELS 3 total assets and shares, particularly among larger credit unions, and the percentage of insured shares those credit unions hold certainly continued. We'll be watching these figures closely during the next quarterly briefing, as well as listening to the remarks of the NCUA board members as they signal how supervision and examination will be adjusting to this data.
- Share on Facebook: NCUA Share Insurance Fund Update: Diving into CAMELS Code Data
- Share on Twitter: NCUA Share Insurance Fund Update: Diving into CAMELS Code Data
- Share on LinkedIn: NCUA Share Insurance Fund Update: Diving into CAMELS Code Data
- Share on Pinterest: NCUA Share Insurance Fund Update: Diving into CAMELS Code Data
« Return to "REGular Blog" Go to main navigation